The pursuit of valuable insights and actionable intelligence is never ending in market research and staying ahead means making informed decisions in real-time. However, the vast amount of data can be overwhelming and difficult to navigate. Dashboard solutions, with their intuitive visualisations and analytical capabilities, provide market researchers clarity by helping them navigate the complexities of consumer behaviour, industry trends, and competitive landscapes
Understanding Dashboards in Market Research
For too long primary market research analysis has relied on old, inefficient, and time consuming manual processes. It’s time to embrace 21st century analytical solutions and speed up the exploratory data analysis (EDA).
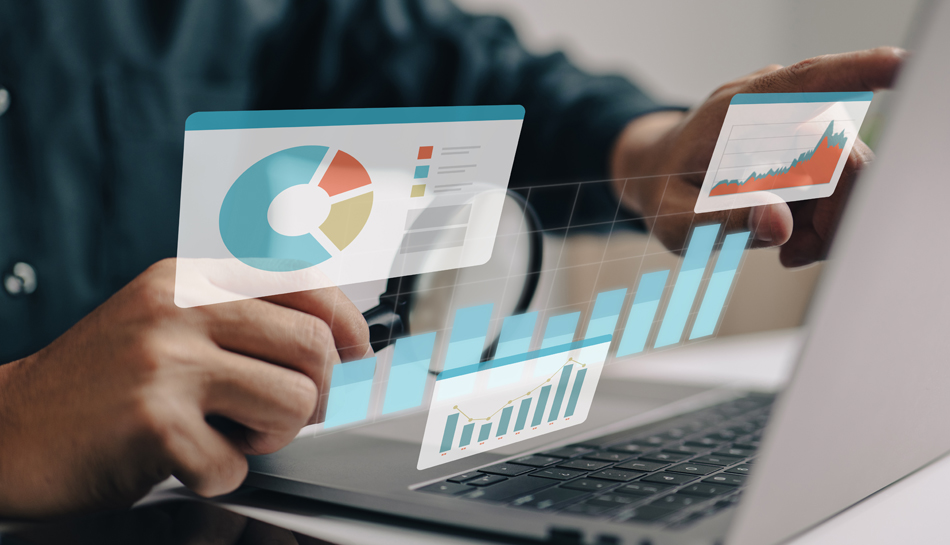
A dashboard serves as a strategic command centre, consolidating diverse datasets and distilling them into digestible insights. Acting as the compass that helps guide researchers through the information overload, presenting key metrics, trends, and performance indicators in a cohesive and accessible format. Through an array of visual elements including charts and graphs, dashboards reveal patterns, correlations, and anomalies that might otherwise remain unseen within raw data.
Benefits of Using Dashboards
- Revolutionise Tracker Project Reporting
- On the Fly Results for Adhoc and Trackers Alike
- User Management and Ramp Up
- Excellent Reporting Capabilities
- Exploratory Data Analysis (EDA)
By modernising and streamlining the entire process through a single platform for data management, reporting, and cross tabs you have access to a multitude of benefits that accelerate the project reporting process. With real-time tracking capabilities, dashboards provide instant access to project progress and key performance metrics, helping teams stay informed and agile in response to current trends and changing conditions.
The dynamic nature of dashboards facilitates faster decision-making by presenting up-to-date information in a visually compelling format that enables stakeholders to focus on key insights. By automating data aggregation and visualisation, dashboards reduce the time and effort required to generate reports. Additionally, the customisable aspect allows the dashboards to be tailored in order to meet specific needs.
Dashboard solutions offer several benefits related to dynamic data and user management, improving functionality and usability. They integrate with various data sources, allowing users to consolidate data for comprehensive analysis. Users can customise data views, select specific metrics, and apply filters for focused insights. Interactive features enable users to explore data deeply, while robust user management ensures data security through role-based access control. Additionally, dashboards scale efficiently to accommodate growing data volumes and user traffic, maintaining performance and accessibility.
By offering a valuable hierarchical function, dashboards simplify the process of generating market reports with just a click of the button. This lets users organise data hierarchically, making it easier to navigate and analyse complex datasets. With a click of a button, users can generate customised market reports tailored to their needs and preferences, reports directly exported into MS PowerPoint (editable charts). This approach saves time and effort, giving users access to actionable insights efficiently.
With heightened control, users can address questions on the fly effortlessly using advanced dashboard functionalities. This expanded user control facilitates real-time data manipulation and interaction, so that individuals can explore trends, analyse metrics, and extract insights. With intuitive interfaces and tailored features, users can adjust parameters, apply filters, and review specific data points. This enables informed decision-making and simplifies adaptation to evolving circumstances.
Conclusion
Dashboard solutions are revolutionising market research by streamlining processes and enhancing efficiency. With instant access to visualisations, users can stay ahead of trends in real-time without the delays of manual data input. These solutions offer fast turnaround times, allowing for one-click generation of regional or country specific reports once global templates are set up. By modernising long-standing trackers, reporting time is 60% faster, supported by clear migration plans that address data management and optimisation. This approach eliminates redundant processes and inconsistencies.
Embrace the future of analysis with dashboard solutions.
